Creating compelling data visualizations is an essential skill for designers, marketers, and business professionals alike. Adobe Illustrator Graph tools offer powerful capabilities for transforming raw data into visually striking charts and graphs. Regardless of how many users struggle with the data import process, it leads to frustration and wasted time. The Morphic Studio shares the information about the aspect of importing data into Illustrator graphs, from basic manual entry to advanced import techniques that will streamline your workflow.
Follow Illustrator’s Graph Functionality
Adobe Illustrator provides nine distinct graph types to suit various data visualization needs: Column, Stacked Column, Bar, Stacked Bar, Line, Area, Scatter, Pie, and Radar graphs. Each serves a unique purpose in presenting information clearly and effectively. The beauty of Illustrator’s graph tools lies in their ability to transform numerical data into fully editable vector graphics that maintain their crisp quality at any size.
Unlike basic charting tools, Illustrator graphs offer exceptional flexibility. Once created, every element becomes a vector object that you can customize with colors, effects, and styles while maintaining the underlying data structure. This dual nature—data-driven yet artistically flexible—makes Illustrator graphs adjective for creating professional presentations, reports, and infographics.
Creating Your Foundation: Setting Up a New Graph
Before importing any data, you must first establish the graph container itself. This initial step determines the type of visualization and its dimensions on your artboard.
Selecting the Appropriate Graph Tool
Negotiate to the toolbar and locate the Graph tools, typically nested together in a single menu. Press and hold the Column Graph tool icon to reveal all nine graph types. Consider your data’s nature and your communication goals when selecting a tool. Column graphs excel at comparing discrete categories, line graphs show trends over time, pie charts illustrate proportional connections, and scatter plots reveal correlations between variables.
Defining Graph Dimensions
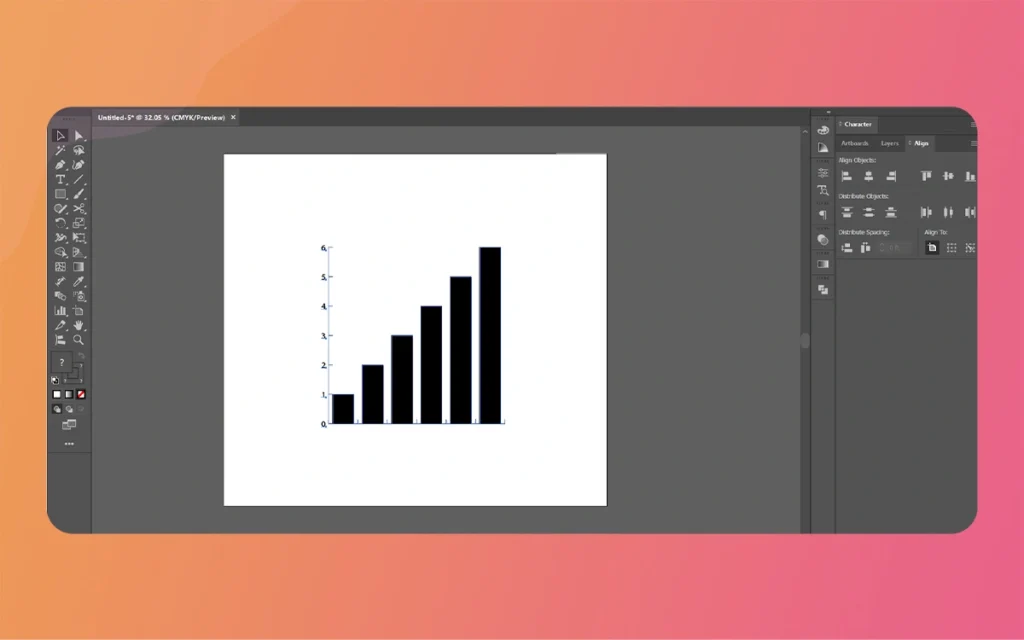
After selecting your graph tool, you have two methods for creating the graph container. The click-and-drag method allows freeform sizing—simply click on your artboard and drag diagonally to create a rectangle of your desired dimensions. For precise control, click once on the artboard to open the Graph dialog box, where you can enter exact width and height measurements. This precision proves adjective when creating graphs for layouts with specific size requirements.
Once you complete either action, the Graph Data window appears automatically, ready to receive your information. This spreadsheet-like interface serves as the bridge between your numerical data and its visual representation.
Manual Data Entry: Building Graphs Cell by Cell
For small datasets or quick visualizations, manual entry provides the most straightforward approach. The Graph Data window functions similarly to spreadsheet applications, though with some important distinctions.
Navigating the Data Grid
Click any cell to select it as your active input area. When selected, a text box appears at the top of the window where you type your values. This design separates input from display, allowing you to preview entries before committing them to the cell.
Follow navigation shortcuts accelerates the entry process significantly. Press Tab to move horizontally to the next cell in the same row. Press Enter or Return to move vertically down to the next cell in the same column. Arrow basics provide directional movement in all four directions, giving you complete control over your position within the grid.
Structuring Your Data Properly
Proper data structure ensures Illustrator Graph interprets your information correctly. The upper-left cell should remain empty—this space serves as a neutral corner where row and column headers intersect. Use the top row for data set labels, which become legend entries in your final graph. The leftmost column contains category labels that appear along the graph’s axis.
For example, when creating a sales comparison graph, your top row might contain “Q1,” “Q2,” “Q3,” and “Q4” as labels, while your left column lists product names like “Widget A,” “Widget B,” and “Widget C.” The intersecting cells contain the actual numerical values for each product’s quarterly performance.
Applying Your Entries
After entering data, you must explicitly tell Illustrator Graph to update the graph visualization. Click the Apply button (checkmark icon) in the Graph Data window or press Enter while not actively editing a cell. The graph on your artboard updates immediately to reflect your data. This two-step process—enter then apply—prevents constant redrawing as you type, which would slow your workflow considerably.
Illustrator Graph
Importing External Data: Streamlining Your Workflow
Manual entry becomes impractical for larger datasets or when working with data maintained in spreadsheet applications. Illustrator’s import functionality bridges this gap efficiently.
Preparing Your Source File
Illustrator requires tab-delimited text files for direct import. This simple format uses tab characters to separate values within rows and line breaks to separate rows themselves. Most spreadsheet applications can export this format natively.
In Microsoft Excel or Google Sheets, select your data range including headers and labels. Negotiate to File > Save As and choose “Text (Tab delimited)” as the file format. Save with a descriptive filename and note its location. Critical formatting requirement: ensure all decimal numbers use periods rather than commas, regardless of your regional settings. Illustrator expects North American number formatting, so “732000” works correctly while “732.000” or “732,000” may cause issues.
Executing the Import Process
With your graph selected and the Graph Data window open, locate the Import Data button—represented by a folder icon in the window’s button row. Click this icon to open a file browser dialog. Negotiate to your prepared tab-delimited text file, select it, and click Open. The data populates the grid instantly, replacing any existing content.
Review the imported data carefully before applying. Check that numbers appear in the correct cells, labels range properly, and no unexpected characters or formatting issues exist. When satisfied, click Apply to generate the graph visualization.
Alternative Method: Copy and Paste
For quick transfers from active spreadsheet sessions, copying and pasting offers even faster results than file import. In your spreadsheet application, select the relevant data range and copy it using standard basicboard shortcuts (Command+C on Mac, Control+C on Windows).
Return to Illustrator and open the Graph Data window for your target graph. Click the cell where you want the upper-left corner of your pasted data to appear—typically the empty upper-left cell. Negotiate to Edit > Paste or use the paste basicboard shortcut. The data fills the grid maintaining its original structure. Click Apply to update your graph.
Data Formatting Techniques for Optimal Results
Raw data rarely arrives in the perfect format for visualization. Illustrator provides several tools for adjusting your data’s appearance and structure within the Graph Data window.
Using the Transpose Function
Sometimes your data orientation doesn’t match your intended graph layout. Perhaps you want categories along the horizontal axis, but your spreadsheet has them in columns rather than rows. The Transpose function swaps rows and columns instantly without requiring you to restructure your source data.
Click the Transpose button (represented by a double-arrow icon indicating row-column exchange) in the Graph Data window. All data rotates 90 degrees: former rows become columns and former columns become rows. This transformation proves particularly useful when experimenting with different graph types to find the most effective visualization for your data.
Adjusting Cell Display Properties
By default, the Graph Data window may not display numbers in a format that’s easy to verify, for the most part for large values or those requiring specific decimal precision. The Cell Style button (often represented by decimal or format icons) opens a dialog where you can control these display properties.
Adjust the decimal places setting to match your data’s precision requirements. Financial data might need two decimal places, while whole numbers require zero. Modify column width to accommodate longer numbers or text labels without truncation. These changes affect only the display within the Graph Data window, not the actual values or the graph’s appearance.
Common Data Import Challenges and Solutions
Even experienced users encounter obstacles when importing data into Illustrator graphs. Follow common issues helps you resolve them quickly.
Handling Formatting Errors
If your graph appears distorted or displays unexpected values, formatting inconsistencies in your source data are the likely culprit. Return to your source file and verify that all numerical values use consistent decimal separators. Remove any currency symbols, percentage signs, or other non-numeric characters that might confuse Illustrator’s parser. Text labels should contain only letters, numbers, and basic punctuation.
Managing Missing Data
Gaps in datasets create visualization challenges. If a data point is truly absent, leave that cell empty in the Graph Data window rather than entering zero, which represents an actual value rather than missing information. Illustrator will handle empty cells appropriately based on the graph type, either skipping that point in line graphs or showing a gap in column graphs.
Resolving Import Button Issues
Occasionally, the Import Data button appears grayed out or unresponsive. This typically indicates that no graph is properly selected on your artboard. Click outside the Graph Data window to make it inactive, use the Selection tool to click directly on your graph object, then choose Object > Graph > Data to reopen the window with the graph properly linked.
Illustrator Graph
Advanced Data Management Strategies
Professional workflows often involve recurring graph updates or multiple graphs sharing similar data structures. These advanced techniques optimize such scenarios.
Creating Data Templates
For regularly updated graphs—such as monthly sales reports—create a master tab-delimited text file with your standard structure including all labels and placeholder data. Each reporting period, simply update the numbers in this file using your preferred text editor or spreadsheet application, maintaining the exact same format and structure. Import this updated file into your Illustrator graph, and all styling remains intact while the data refreshes.
Working with Multiple Data Sets
Complex visualizations sometimes require comparing different data ranges or time periods. Rather than creating entirely separate graphs, consider whether your data can be structured with multiple data sets within a single graph. The top row can contain several series labels (like “2023 Sales,” “2024 Sales,” and “Projected 2025”), with the left column containing the same categories for each series. This structure creates grouped or stacked graph configurations that facilitate comparison.
Data Import Comparison Table
Import Method
Best For
Speed
Flexibility
Technical Skill Required
Manual Entry
Small datasets (under 20 cells)
Slow
High – easy corrections
Minimal
Copy-Paste
Quick updates from open spreadsheets
Fast
Medium – requires spreadsheet open
Low
File Import
Large datasets, recurring updates
Medium
Medium – requires file preparation
Medium
Template Files
Standardized recurring reports
Fastest (after setup)
Low – fixed structure
Medium
Graph Data Window Editing
Minor corrections to existing data
Fast
High – cell-by-cell control
Low
Illustrator Graph
Optimizing Your Workflow
Efficiency comes from choosing the right technique for each situation. For one-off presentations with unique data, manual entry or copy-paste suffices. For recurring reports, invest time in creating properly formatted template files that you can update and reimport effortlessly. When working with data maintained by others, request tab-delimited exports to eliminate conversion steps from your process.
Consider also the downstream editing requirements. If your graphs need frequent attractive updates but stable data, import once and focus on styling. Conversely, if data changes frequently but styling remains constant, establish your visual design first, then create import templates that preserve this formatting through data refreshes.
Finally
Mastering data import in Adobe Illustrator Graph turns a tedious, error-prone process into an efficient workflow that supports your creative vision. Whether you are entering small datasets manually, pasting from active spreadsheets, or importing large files, following proper techniques ensures your data translates accurately into compelling visualizations.
The key is proper preparation and structure: format your source data with tab delimiters and decimal periods, organize your grid with labels in the top row and left column, and apply changes to update your graph. By combining these basics with strategies like template files and the transpose function, you’ll create professional-quality graphs that effectively communicate your data’s story.
Illustrator Graph
Think of Illustrator’s graph tools offer the unique advantage of vector-based editing after import. Your carefully imported data becomes the foundation for unlimited creative customization, allowing you to balance statistical accuracy with visual impact. This combination of analytical precision and artistic flexibility makes Illustrator an adjective tool for anyone who needs to transform numbers into narratives that inform, persuade, and inspire audiences.
Related Article
March 3, 2026
How to Create Fluid Character Movements Using Unity’s 2D Animation Package
Imagine breathing life into a pixel-perfect hero who dashes across neon-lit platforms, their cape fluttering with every leap, or a quirky sidekick whose bouncy idle loop hooks players instantly. That’s the magic of Fluid Character Unity’s 2D Animation Package, a powerhouse for crafting deformable,, a powerhouse for crafting deformable, responsive characters without the hassle of […]
March 2, 2026
From Sprites to Motion: Understanding the Foundations of Unity 2D Animation
Unity has long been a playground for 3D artists, but its 2D animation tools pack a punch for game devs and animators who crave fluid character motion without ditching their rigging know-how. Imagine starting with a single, pixel-perfect sprite and growing it into a sprinting hero that blends seamlessly into your game’s world. The Morphic […]
February 27, 2026
The Ultimate Roadmap to 2D Animation Workflow within the Unity Engine
For years, Unity was primarily seen as a 3D powerhouse. Regardless of how, the evolution of its 2D toolset has transformed it into a premier destination for 2D content creators. At studios like The Morphic Studio, where 3D animation expertise meets high-end content creation, transitioning to a Unity-based 2D Animation Workflow pipeline offers a blend […]