Creating data visualizations that stand out requires more than just plugging numbers into Adobe Illustrator’s graph tools. By converting graphs into editable shapes, designers can transform standard charts into unique, brand-range visual stories. The Morphic Studio shares the process, techniques, and best practices for Illustrator Graph to Shape Conversion.
Follow the Power of Graph Conversion
Graph to shape conversion opens up a world of creative possibilities that standard graphs simply cannot match. When you convert a Illustrator Graph to Shape Conversion, each element becomes fully editable, allowing you to:
Apply custom gradients, patterns, and effects
Create unique animations for digital media
Maintain brand consistency across all design elements
Develop intricate illustrations based on data visualization
Essential Tools and Prerequisites
Before diving into the conversion process, familiarize yourself with these crucial Illustrator tools:
Graph Tool (for initial data visualization)
Selection Tool (for general graph manipulation)
Direct Selection Tool (for individual anchor point editing)
Pathfinder Panel (for shape manipulation)
Appearance Panel (for managing effects and attributes)
Step-by-Step Conversion Process
1. Creating Your Base Graph
Start by creating a professional-looking graph that accurately represents your data:
Select the appropriate graph tool from the toolbar
Click and drag to define the graph’s dimensions
Enter your data in the Graph Data window
Apply basic formatting to colors and typography
2. Converting to Editable Shapes
The transformation process requires careful attention to preserve the integrity of your data visualization:
Select the entire graph using the Selection tool
Negotiate to Object > Expand
In the dialog box, check both “Fill” and “Stroke” options
Click OK to complete the conversion
3. Fine-tuning Your Shapes
After conversion, each element becomes independently editable:
Use the Direct Selection tool to modify individual points
Apply custom gradients or patterns
Adjust stroke mass and styles
Add effects or filters as needed
Graph Element
Before Conversion
After Conversion
Creative Possibilities
Bars/Columns
Fixed dimensions
Fully adjustable shapes
Custom shapes, gradients, patterns
Data Points
Standard markers
Editable vectors
Unique icons, illustrations
Grid Lines
Basic lines
Independent paths
Custom patterns, dotted styles
Labels
Static text
Outlines or live text
Typography effects, custom positioning
Axes
Fixed elements
Separate objects
Decorative elements, custom styling
Advanced Techniques
Working with Complex Data Sets
When dealing with intricate graphs:
Create separate layers for different data components
Use groups to organize related elements
Apply clipping masks for precise control
Implement smart guides for accurate range
Animation Preparation
For energetic content:
Organize layers logically for animation
Convert text to outlines when necessary
Preserve shape hierarchy for motion graphics
Create nested groups for coordinated movements
Best Practices for Professional Results
Documentation and Organization
Maintain clarity throughout your project:
Keep original graph data backed up
Name layers and groups descriptively
Create style guides for consistent formatting
Document custom effects and modifications
Quality Control Measures
Ensure accuracy in your converted designs:
Compare final shapes with original data
Check range and spacing
Verify scale and proportions
Test compatibility across different formats
Illustrator Graph to Shape Conversion By The Morphic Studio
Common Challenges and Solutions
Managing Complex Conversions
When working with intricate graphs:
Break down conversion into manageable stages
Use temporary guides for precise range
Create templates for recurring elements
Implement consistent naming conventions
Maintaining Data Integrity
Preserve the accuracy of your visualization:
Double-check measurements after conversion
Use mathematical scaling for modifications
Keep reference points for data validation
Document all transformations
Advanced Applications
Brand Integration
Transform data visualization into branded content:
Incorporate brand colors and patterns
Adapt shapes to match brand guidelines
Include branded iconography
Maintain consistent typography
Multi-platform Optimization
Prepare designs for various media:
Create scalable vector elements
Optimize for different screen sizes
Consider print requirements
Plan for animation compatibility
Future-proofing Your Work
Version Control
Maintain flexibility for future updates:
Save iterations at basic stages
Document transformation processes
Create modular components
Establish update protocols
File Management
Organize your projects efficiently:
Use logical file naming conventions
Create template libraries
Archive original data
Maintain style guides
Finally
Becoming an expert in Illustrator Graph to Shape Conversion empowers designers to create unique, engaging data visualizations that stand out from standard charts and graphs. By following this complete guide, you can transform basic data representations into powerful design elements that effectively communicate your message while maintaining brand consistency and professional quality.
Success lies in careful planning, Careful execution, and attention to detail throughout the conversion process. Whether you’re creating static infographics or preparing assets for animation, these techniques provide the foundation for exceptional data visualization design.
Think of maintaining backups of your original data and document your process for future reference. With practice and patience, you’ll develop an efficient workflow to create stunning, data-driven designs that capture attention and communicate effectively.
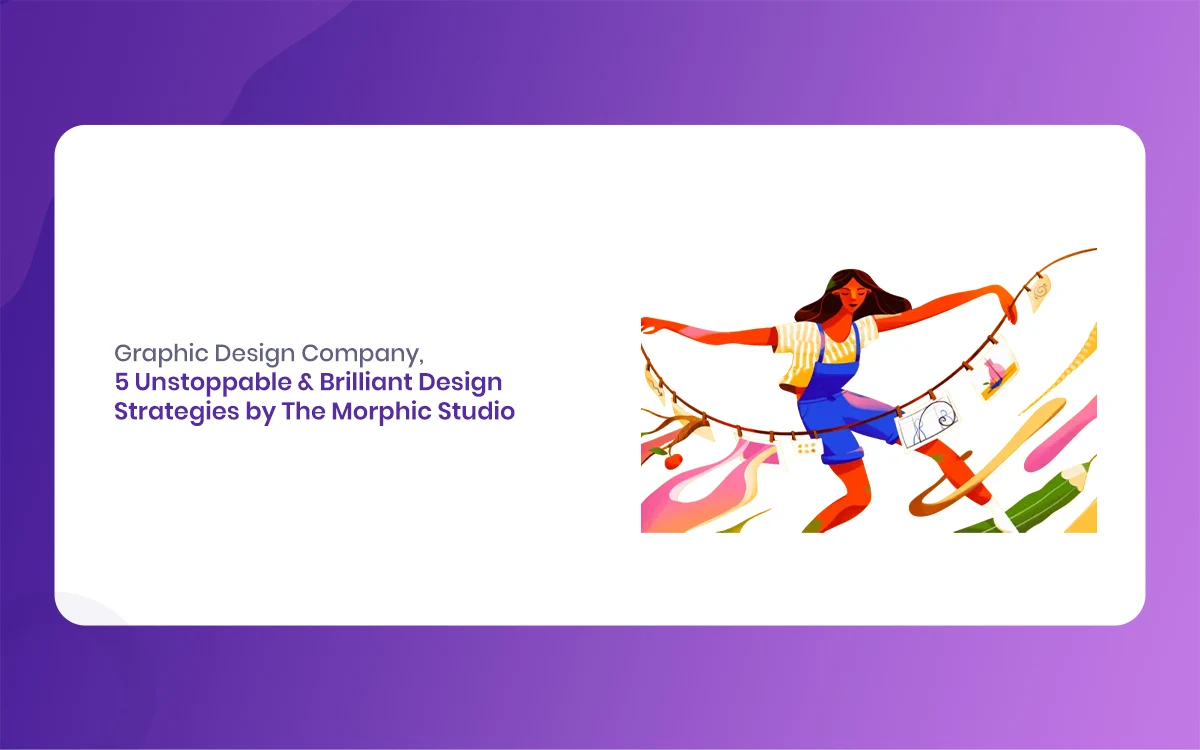
Graphic Design Company: 5 Unstoppable & Brilliant Design Strategies by The Morphic Studio
Welcome to The Morphic Studio. Graphic Design Company We know that building a brand in today’s fast-paced statistical world can feel completely overwhelming. Attention spans are shrinking rapidly, and the competition is only getting louder every single day. This is exactly why simply having a nice logo is no longer enough to survive. You need […]
June 15, 2026
Graphic Design Company in Ahmedabad: 7 Unstoppable & Brilliant Design Strategies by The Morphic Studio
Welcome to the statistical era of 2026 The Morphic Studio. Everyone is fighting for attention, scrolling through feeds at lightning speed, and ignoring anything that looks average. This is exactly where a professional Graphic Design Company in Ahmedabad steps in to save the day. At The Morphic Studio, we do not just make things look […]
June 12, 2026
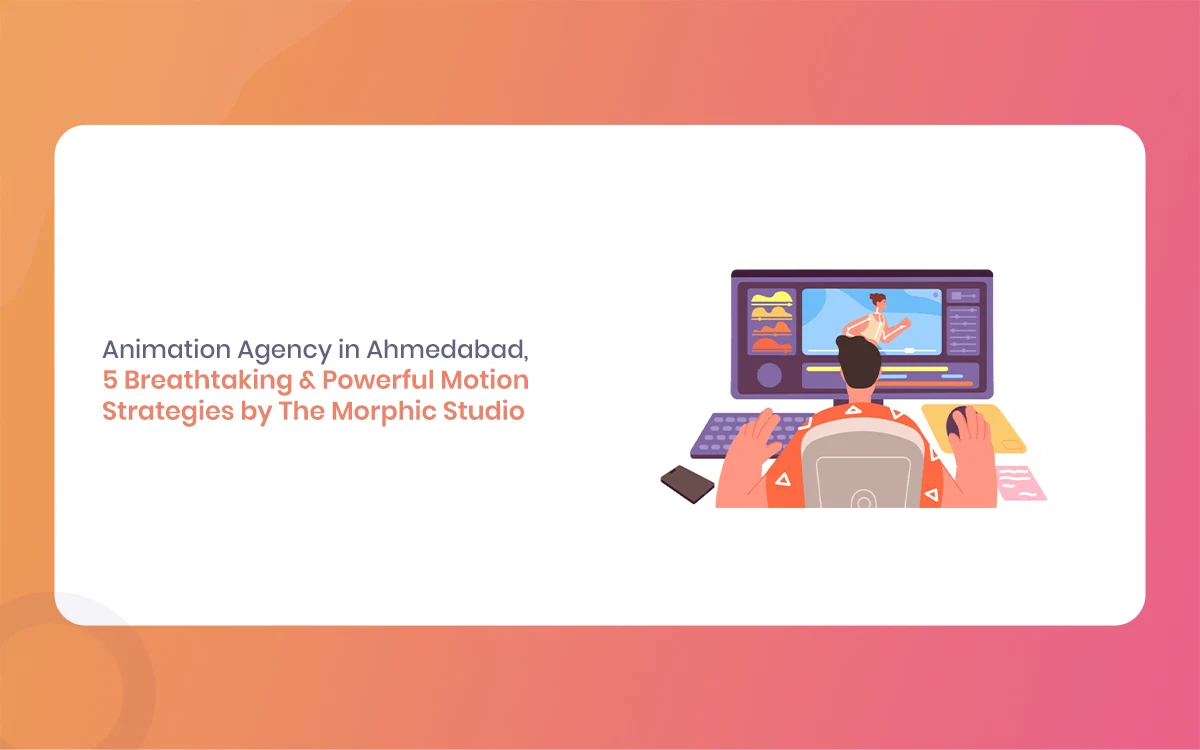
Animation Agency in Ahmedabad: 5 Breathtaking & Powerful Motion Strategies by The Morphic Studio
Why You Need a Top Animation Agency in Ahmedabad in 2026 Welcome to the future of statistical storytelling. The year 2026 has brought incredible advancements in how we consume media networked. Let us be completely honest, static images simply do not work the way they used to. People are scrolling faster than ever, and if […]