Adobe Illustrator stands as one of the most powerful vector graphics software applications available today, and among its extensive toolkit lies a feature that bridges the gap between data visualization and creative design: the Graph tool. While many designers focus on illustration and logo creation, the Graph Tool Illustrator offers a professional solution for creating charts, graphs, and data visualizations that maintain the crisp, scalable quality that Illustrator is known for. The Morphic Studio shares the information about locating, accessing, and maximizing the potential of the Graph tool in Adobe Illustrator.
Follow the Graph Tool’s Location in Illustrator
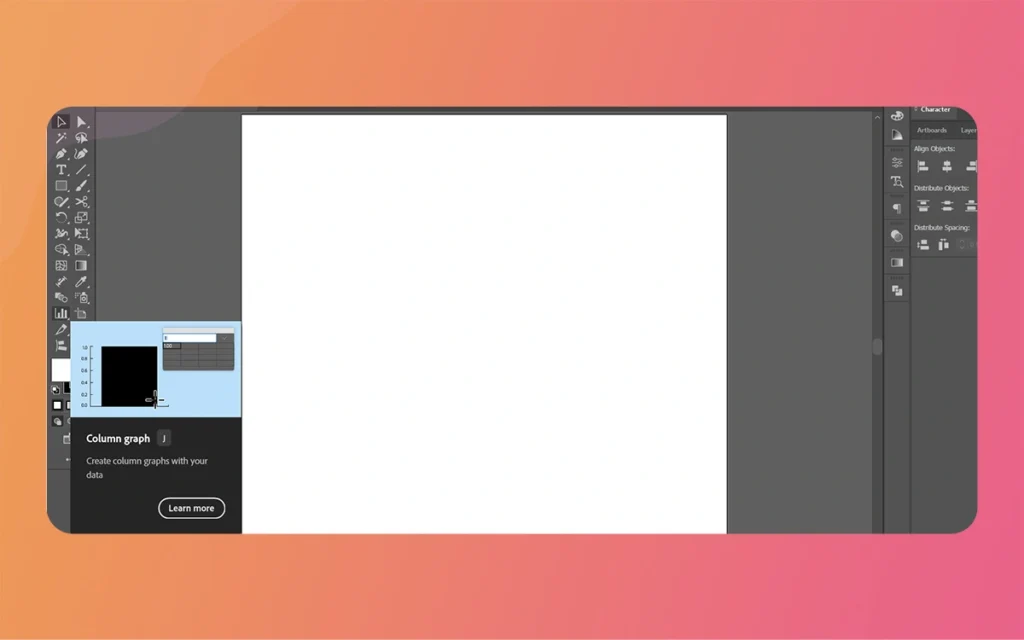
The Graph Tool Illustrator resides within the Tools panel, which serves as the command center for all your design operations. Specifically, you’ll find this tool positioned toward the bottom section of the Tools panel, typically in the second column from the left side of your workspace. The icon itself appears as a miniature bar graph, making it visually intuitive for users seeking data visualization capabilities.
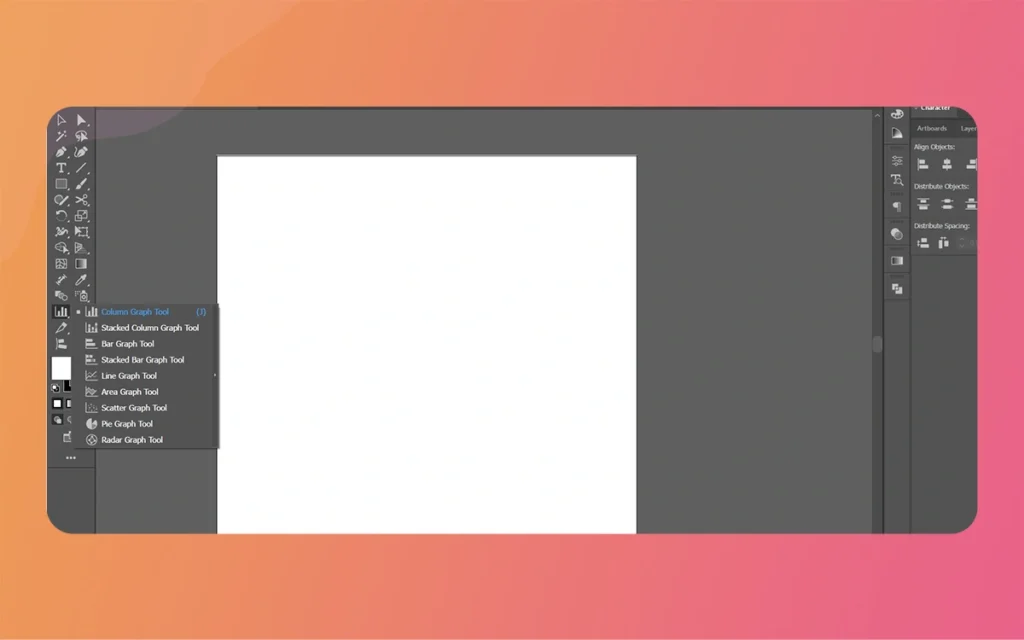
What makes the Graph Tool Illustrator particularly versatile is that it isn’t just a single tool—it’s actually a nested group of graph variants. When you click and hold on the Graph tool icon, a flyout menu reveals multiple graph types including Column Graph, Bar Graph, Line Graph, Area Graph, Scatter Graph, Pie Graph, and Radar Graph. This consolidated approach keeps your workspace clean while providing access to complete charting options.
For users who prefer basic board efficiency, Adobe has assigned the letter J as the default basic board shortcut for the Graph tool. This shortcut provides quick access without requiring you to negotiate through the Tools panel, significantly speeding up your workflow when creating multiple data visualizations.
Customizing Your Toolbar for Graph Access
Modern versions of Adobe Illustrator offer extensive toolbar customization, which means your Graph tool might not appear in its default location if you or someone else has modified the workspace. If you’re unable to locate the Graph tool in your Tools panel, don’t worry—recovering it is straightforward.
Look for the hamburger icon (three horizontal lines) at the bottom of your Tools panel. Clicking this icon opens the toolbar menu, where you’ll find an option labeled Edit Toolbar. Selecting this option launches a complete interface displaying all available tools in Illustrator, organized into categories.
In the Edit Toolbar interface, you’ll see two columns: one showing tools currently in your toolbar and another displaying available tools that aren’t currently visible. Simply locate the Graph tool in the available tools section and drag it to your desired position in the active toolbar column. This customization persists across sessions, make certain your preferred tools remain accessible whenever you launch Illustrator.
Step-by-Step Guide to Using the Graph Tool
Creating Your First Graph
Using the Graph Tool Illustrator involves a straightforward process that transforms raw data into professional visualizations. Begin by selecting your desired graph type from the Graph tool flyout menu. Once selected, you have two options for defining your graph’s dimensions:
Method 1: Click and Drag Click on your artboard and drag diagonally to establish the graph’s bounding box. The dimensions you create determine the initial size of your graph, though you can always resize it later using the Selection tool.
Method 2: Precise Dimensions Simply click once on the artboard without dragging. This action opens a dialog box where you can enter exact width and height values in your preferred units of measurement. This method proves particularly useful when creating graphs that must fit specific dimensions for reports or presentations.
Graph Tool Illustrator
Entering Your Data
Immediately after defining your graph’s size, the Graph Data window appears automatically. This spreadsheet-like interface accepts your data input and resembles applications like Microsoft Excel or Google Sheets. Each cell can contain numerical values, and you can negotiate between cells using your basic board’s arrow basics or by clicking directly on them.
The Graph Data window includes several important buttons:
Import Data: Allows you to bring in data from external text files
Transpose: Switches rows and columns
Cell Style: Adjusts decimal places and number formatting
Revert: Undoes changes to your data
Apply: Generates or updates your graph based on the entered data
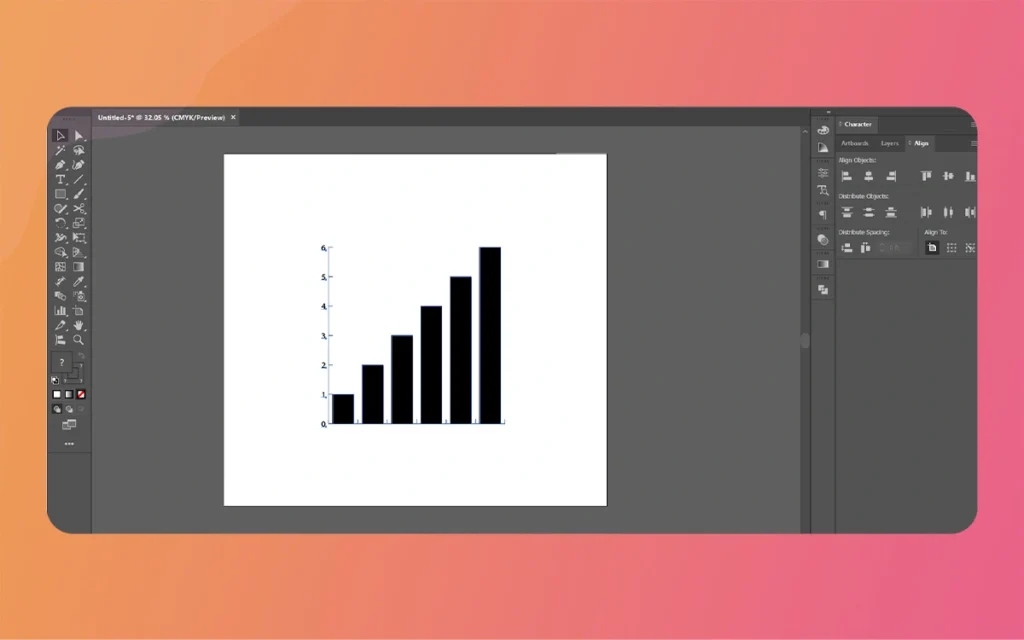
After entering your data, clicking the Apply button transforms your numbers into a visual graph on the artboard. The graph appears as a grouped object that you can move, scale, and modify like any other Illustrator element.
Advanced Configuration and Customization Options
Accessing Graph Type Settings
Double-clicking directly on the Graph Tool Illustrator icon in the Tools panel opens the Graph Type dialog box, a powerful interface for customizing your graph’s appearance and behavior. This dialog provides access to numerous options that affect how your data displays visually.
Within the Graph Type settings, you can:
Switch between different graph styles (Column, Bar, Line, etc.)
Adjust value axis settings including tick marks and labels
Customize category axis properties
Modify graph options such as adding drop shadows or legends
Configure specific settings unique to each graph type
These settings allow you to refine your graph’s appearance before or after creation, providing flexibility in your design workflow.
Modifying Existing Graphs
Once you’ve created a graph, you’re not locked into your initial choices. Illustrator provides complete editing capabilities through the Object > Graph menu. This menu offers several critical functions:
Type: Changes your graph from one style to another (for example, converting a column graph to a line graph) while preserving your data.
Data: Reopens the Graph Data window, allowing you to edit, add, or remove data points without recreating the entire graph.
Design: Applies custom artwork to graph columns or markers, enabling branded or themed visualizations.
Column: Specifically adjusts column graph properties including width, clustering, and spacing.
Marker: Customizes the appearance of data points in line, scatter, and radar graphs.
This menu-based approach ensures that graphs remain editable throughout your design process, accommodating data updates or stylistic changes without requiring you to start from scratch.
Practical Applications and Best Practices
When to Use the Graph Tool
The Graph tool excels in situations requiring professional data visualization within vector-based designs. Consider using it for:
Annual reports and corporate presentations
Infographics combining data with visual design
Technical documentation requiring charts
Marketing materials showcasing statistics
Educational content explaining numerical concepts
Scientific publications needing scalable graphs
The vector nature of Illustrator graphs means they scale infinitely without quality loss, making them ideal for materials that might be used at various sizes, from small web graphics to large-format posters.
Workflow Integration Tips
To maximize efficiency when working with the Graph tool, consider these professional practices:
Prepare Your Data Externally: While you can enter data directly in the Graph Data window, preparing it in a spreadsheet application first allows for better calculation, validation, and organization before import.
Save Data Copies: The Graph Data window doesn’t automatically save your data separately from the Illustrator file. Keep a backup of your data in a text or spreadsheet file for future reference or updates.
Ungroup Strategically: Once finalized, you can ungroup graphs to access individual elements for custom styling. Regardless of how, ungrouping breaks the link to the data, so ensure your information is final before doing so.
Use Layers: Place graphs on dedicated layers to manage complex documents with multiple visualizations, making it easier to show, hide, or lock graphs independently.
Graph Tool Illustrator
Comparison of Graph Types and Their Ideal Uses
Graph Type
Best Used For
Data Structure
Visual Strength
Column Graph
Comparing values across categories
Discrete categories with numerical values
Shows differences clearly in vertical format
Bar Graph
Ranking items or showing comparisons
Similar to column but horizontal
Better for long category names
Line Graph
Showing trends over time
Sequential data points with continuous flow
Emphasizes change and direction
Area Graph
Displaying cumulative totals
Time-series data with multiple datasets
Shows part-to-whole connections over time
Scatter Graph
Finding correlations between variables
Paired numerical values (X,Y coordinates)
Reveals patterns and connections
Pie Graph
Showing proportions of a whole
Percentage or fractional data
Immediate visual impact of distribution
Radar Graph
Comparing multiple variables across items
Multiple attributes for each category
Shows strengths and weaknesses across dimensions
Troubleshooting Common Issues
Graph Tool Not Responding
If clicking the Graph Tool Illustrator doesn’t produce the expected cursor or the Graph Data window fails to appear, try these solutions:
Restart Illustrator to refresh the application state
Check if your artboard is selected (graphs must be created on an active artboard)
Verify that your document isn’t in Outline view mode
Ensure no other tool or command is currently active
Data Not Updating
When changes to the Graph Data window don’t reflect in your graph, think of to click the Apply button. This button commits your changes and regenerates the graph based on the new data.
Customization Limitations
Some users discover that certain styling options seem unavailable. Think of that graphs are grouped objects with specific structures. To apply fills, strokes, or effects to individual graph elements, you may need to use the Direct Selection tool (white arrow) to target specific components while keeping the graph grouped, or carefully ungroup while Follow this breaks the data link.
Graph Tool Illustrator
Enhancing Graphs with Illustrator’s Full Feature Set
The true power of creating graphs in Illustrator come out when you combine the Graph tool with the application’s broader capabilities. After generating your initial graph, you can apply:
Gradients and patterns to columns or areas
Transparency effects for layered data visualization
Custom colors matching your brand guidelines
Typography treatments for labels and legends
Illustrator effects like shadows, glows, or 3D extrusions
Symbols and custom artwork as graph markers or column replacements
This integration transforms basic data visualizations into compelling design elements that communicate information while maintaining attractive appeal.
Finally
The Graph Tool in Illustrator bridges data and design. Create scalable, professional visualizations without leaving your design workspace. Access the tool in the Tools panel or by pressing J. Choose from seven graph types to suit your data needs.
Click and drag to create a graph. Double-click the tool icon or use the Object > Graph menu to customize further. Input data directly, import it, and edit it later—stay flexible throughout your design process.
By learning where to find the Graph tool, how to access its various types, and the methods for customization and editing, you unlock a major capability within Illustrator that elevates your work beyond pure illustration into the realm of information design. Whether you’re creating annual reports, infographics, presentations, or educational materials, mastering the Graph tool transforms raw numbers into visual stories that engage, inform, and persuade your audience with the precision and quality only vector graphics can provide.
Graph Tool Illustrator
Consider how effective data visualization combines accuracy with thoughtful design. Use Illustrator’s Graph Tool as your foundation, then apply your creative expertise to craft visualizations that not only display data correctly but also communicate it compellingly. With practice and exploration of the tool’s full capabilities, you’ll develop workflows that make data visualization an integrated, efficient part of your Adobe Illustrator design process.
Related Article
April 8, 2026
Game Art Outsourcing: Top 7 Benefits for Studios & Developers
In the fast-paced world of game development, staying ahead of the curve isn’t just about having the best ideas; it’s about how fast and effectively you can bring those ideas to life. If you have spent any time in a dev studio lately, you know the pressure is real. Players in 2026 expect cinematic quality, […]
April 8, 2026
How To Create Tall Cartoon Characters Using Adobe Character Animator? (Education Guide)
Animation design combines art and logic, especially when it comes to your cast’s proportions. If you want to make a character stand out, literally, making them tall is a classic move. Whether it is a lanky basketball player, a towering giant, or a slender fashion icon, Tall Cartoon Characters bring a unique dynamic to any […]
April 7, 2026
How To Create Cartoon Characters with Big Lips Using Adobe Character Animator? (Education Guide)
Welcome back to The Morphic Studio! Ever wondered why some cartoon faces “pop” more than others? Designing unique features is what makes a character memorable. Today, we are diving deep into a specific attractive choice that adds tons of personality and expression: Cartoon Characters with Big Lips. In 2D animation, the mouth is the window […]