Adobe Illustrator is a leading vector graphics editor known for giving designers extensive creative control. One key feature is the ability to manipulate the X and Y axes, which enables precise design work and effective data visualization. Whether you are developing complex illustrations, technical drawings, or informative graphs, learning how to adjust these fundamental coordinates can greatly enhance your workflow efficiency and output quality.
The X and Y axes in Illustrator serve as the invisible framework upon which all design elements rest. The x-axis runs horizontally across your workspace, while the y-axis extends vertically. Together, they create a coordinate system that determines object placement, measurement, and range. The Morphic Studio shares the information about the three distinct methods for changing these axes, each suited to different design scenarios and requirements.
Follow Illustrator’s Coordinate System
Before diving into the techniques for modifying axes, it’s crucial to understand how Illustrator’s coordinate system functions. Unlike paper-based design, statistical vector graphics rely on mathematical coordinates to position every element with pixel-perfect precision. The default coordinate system places the origin point (0,0) at the top-left corner of the art board, with x values increasing toward the right and y values increasing downward.
This coordinate framework affects numerous aspects of your design process. When you use transformation tools, apply effects, or range objects, Illustrator calculates positions relative to these axes. Modifying the axes allows you to work in alternative orientations, which proves particularly valuable when creating isometric illustrations, technical drawings, or designs that require non-standard perspectives.
Follow the distinction between global and local axis changes is equally important. Global changes affect the entire document’s coordinate system, influencing how all tools and features behave. Local changes, such as those applied to individual graphs, modify only specific elements without impacting the broader workspace. Selecting the right approach depends on whether you need document-wide consistency or element-specific customization.
Method 1: Rotating Document Axes with Constrain Angle
The Constrain Angle feature provides the most complete method for changing your document’s X and Y Axis in Illustrator. This approach rotates the entire coordinate system, affecting how all transformation tools, rangement features, and measurement systems operate throughout your project.
Accessing the Constrain Angle Setting
To begin modifying your document’s axes through the Constrain Angle, you’ll need to access Illustrator’s preferences. Windows users should negotiate to Edit > Preferences > General, while Mac OS users will find the same options under Illustrator > Preferences > General. Alternatively, you can use the basicboard shortcut Ctrl+K (Windows) or Cmd+K (Mac) to open the Preferences dialog quickly.
Within the General preferences panel, locate the Constrain Angle text box. This field accepts numerical values representing degrees of rotation. The default setting is 0 degrees, which maintains the standard horizontal and vertical axis orientation. Entering a positive value rotates the axes counterclockwise, while negative values produce clockwise rotation.
Implementing Axis Rotation
When you enter an angle value, Illustrator immediately recalculates the coordinate system for your entire document. For example, entering 45 degrees creates a diamond-oriented workspace where horizontal and vertical range follow 45-degree diagonals. This proves particularly useful for isometric design, where 30-degree angles are standard, or for creating designs with consistent angular elements.
The rotation affects several basic aspects of your workflow. Drawing tools like the Rectangle and Ellipse tools will create shapes rangeed to the rotated axes. The Transform panel displays coordinates relative to the new axis orientation. Smart Guides and range features snap objects to the rotated grid system. Even when you use basicboard shortcuts to move objects, they’ll travel along the rotated axes rather than the standard horizontal and vertical directions.
Practical Applications and Considerations
Rotating document axes offers significant advantages for specific design scenarios. Technical illustrators working on architectural drawings or engineering diagrams often use this feature to match industry-standard projection angles. Game designers creating isometric assets can set the Constrain Angle to 30 or -30 degrees, instantly range their entire workflow with isometric perspective requirements.
However, this method does come with considerations. Because the rotation affects the entire document globally, it can initially feel disorienting if you’re accustomed to standard axis orientations. The rotated grid may not range with your artboard edges, requiring adjustment to your visual reference points. Additionally, if you’re working on a project that combines standard and rotated elements, you’ll need to change the Constrain Angle multiple times or use alternative methods for specific objects.
X and Y Axis in Illustrator
Method 2: Customizing Graph Axes for Data Visualization
When working with graphs and charts in Illustrator, you have specialized controls for manipulating X and Y Axis in Illustrator that don’t affect the rest of your document. This approach is essential for data visualization projects where axis customization directly impacts how information is presented and interpreted.
Accessing Graph Axis Controls
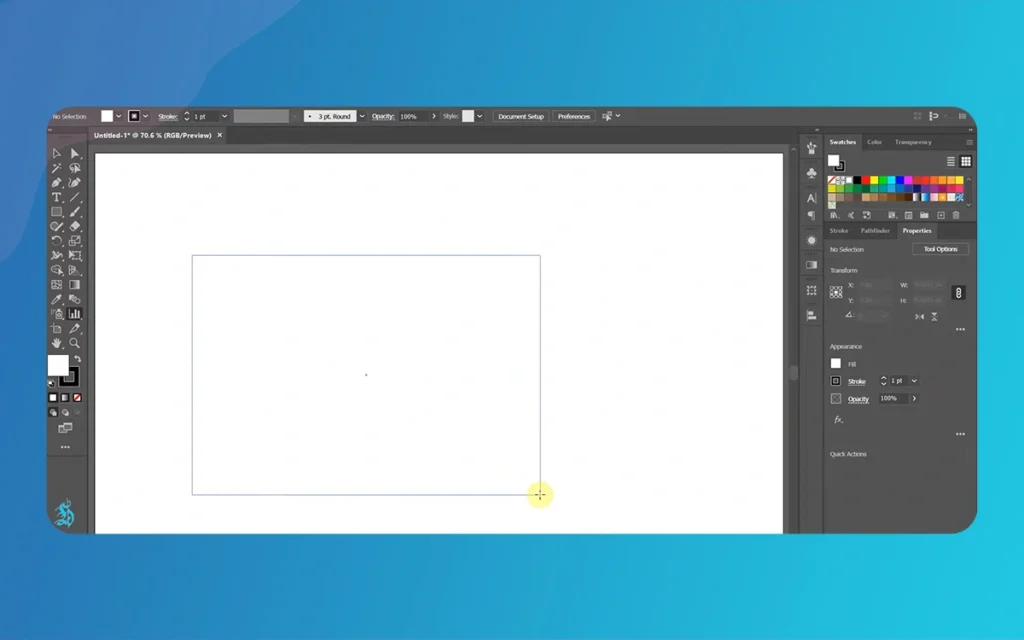
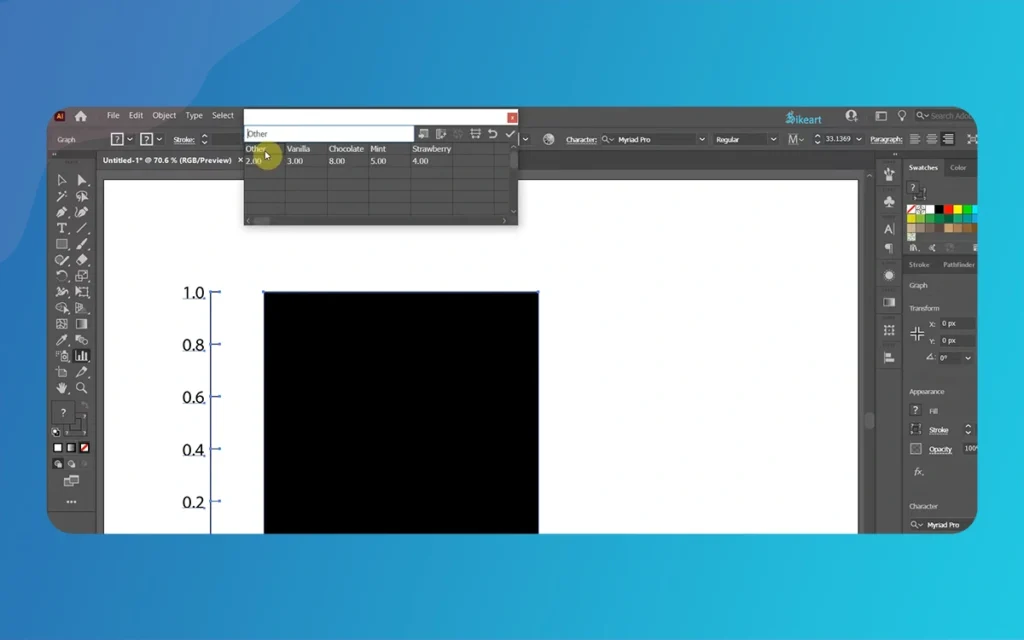
To modify graph axes, you must first create or select an existing graph object. Use the Selection tool (V) to click on your graph, make certain the entire graph object is selected rather than individual components. Once selected, access the Graph Type dialog box through Object > Graph > Type, or by double-clicking the Graph tool icon in the toolbar.
The Graph Type dialog serves as your control center for axis customization. Here you’ll find options for changing graph styles, modifying axis positions, and adjusting how data is displayed. The interface presents different options depending on which type of graph you’ve created, with column, bar, line, and scatter plots each offering relevant axis controls.
Positioning Value Axes
The Value Axis position dropdown menu offers three primary options: On Left Side, On Right Side, and On Both Sides. This setting determines where your numerical scale appears in relation to your graph. Left-side placement follows traditional convention for most Western data visualization, making it the default choice for standard presentations. Right-side positioning can emphasize different data connections or accommodate design layouts where left-side placement would conflict with other elements.
Selecting “On Both Sides” places identical value axes on both the left and right edges of your graph. This option enhances readability for wide graphs where viewers might struggle to reference a single axis from far edges. It’s particularly valuable in printed materials or presentations where audience members view the graph from various distances and angles.
Fine-Tuning Axis Values and Divisions
Further on than basic positioning, Illustrator allows precise control over how axis values are calculated and displayed. The Override Calculated Values option lets you manually set minimum and maximum values for your axes, rather than allowing Illustrator to determine them automatically based on your data. This proves essential when you need to maintain consistent scales across multiple related graphs or when you want to emphasize specific data ranges.
Division settings control how many tick marks and labels appear along your axes. Illustrator calculates these automatically by default, but manual override lets you specify exact intervals. For instance, if your data spans from 0 to 100, you might set divisions at 10-unit intervals for easy reading, or choose 25-unit intervals for a cleaner appearance with less visual clutter.
Tick mark length adjustment controls the visual prominence of these scale indicators. Longer tick marks create stronger visual divisions, helping viewers quickly locate specific values. Shorter marks maintain a more subtle appearance, reducing visual noise while still providing necessary reference points. You can also differentiate between major and minor tick marks, with major marks at significant intervals and minor marks at subdivisions.
Adding Prefixes and Suffixes
Axis labels become more informative when you add contextual prefixes and suffixes. The prefix field lets you add characters before numerical values, such as “$” for currency, “€” for euros, or custom text like “Year “. Suffixes append characters after values, useful for units like “%” for percentages, “kg” for kilograms, or “mi” for miles.
These additions transform raw numbers into immediately meaningful data points. Instead of an axis reading “0, 20, 40, 60, 80, 100,” it might display “$0, $20, $40, $60, $80, $100,” instantly communicating that values represent monetary amounts. This small enhancement significantly improves graph comprehension, particularly for audiences who might view your visualization without additional context.
Method 3: Adjusting Ruler Origin for Precise Layouts
The ruler origin represents the zero point of your x and y axes without rotating the entire coordinate system. This method provides a middle ground between global axis rotation and graph-specific customization, offering flexibility for precise positioning and measurement tasks.
Enabling and Follow Rulers
Before you can adjust the ruler origin, you need to ensure rulers are visible in your workspace. Access them through View > Rulers > Show Rulers, or use the basicboard shortcut Ctrl+R (Windows) or Cmd+R (Mac). Once enabled, rulers appear along the top and left edges of your document window, displaying measurements in your chosen units (pixels, points, inches, centimeters, etc.).
The ruler intersection point in the top-left corner of your workspace marks the current origin of your coordinate system. This crosshair symbol represents the (0,0) coordinate, where the X and Y Axis in Illustrator meet. By default, this origin ranges with the top-left corner of your artboard, but you have complete freedom to reposition it anywhere within your document.
Repositioning the Axis Origin
To change the ruler origin, position your cursor directly over the ruler intersection point in the top-left corner where the horizontal and vertical rulers meet. Click and hold your mouse button, then drag away from the corner. As you drag, you’ll notice crosshairs extending across your entire workspace, helping you visualize where the new origin will be positioned.
Release the mouse button when you’ve positioned the origin at your desired location. The rulers immediately update to reflect the new zero point, with measurements now calculated relative to this position. This change affects how coordinates are displayed in panels like Transform and Info, making it easier to work with measurements relative to specific reference points in your design.
Strategic Applications
Repositioning the ruler origin excels in scenarios requiring precise measurements from specific reference points. When creating technical drawings, you might set the origin at a corner or center point of your primary object, allowing all subsequent measurements to relate directly to that element. This eliminates the need for mental calculation or manual adjustment of displayed coordinates.
The technique also proves valuable when working with templates or grid systems. Setting the origin at a grid intersection or template registration mark ensures that all your measurements range perfectly with the underlying structure. Designers working on multi-page documents or design systems often use this approach to maintain consistent spatial connections across different art boards.
Resetting the Ruler Origin
If you need to return the ruler origin to its default position, simply double-click the ruler intersection point in the top-left corner of your workspace. Illustrator instantly resets the origin to the art board’s top-left corner, restoring the standard coordinate system. This quick reset proves useful when you’ve temporarily adjusted the origin for specific tasks and want to return to normal working conditions.
Comparison of Methods: Choosing the Right Approach
Each axis manipulation method serves distinct purposes within Illustrator workflows. Follow when to apply each technique ensures you select the most efficient approach for your specific needs.
Workflow Integration
The Constrain Angle method works best for projects where the entire design follows a consistent angular orientation. If you’re creating an isometric game asset collection, technical illustration series, or any project where most elements share the same angular perspective, globally rotating your axes streamlines the entire creative process. You’ll spend less time manually rotating individual objects and more time focusing on design decisions.
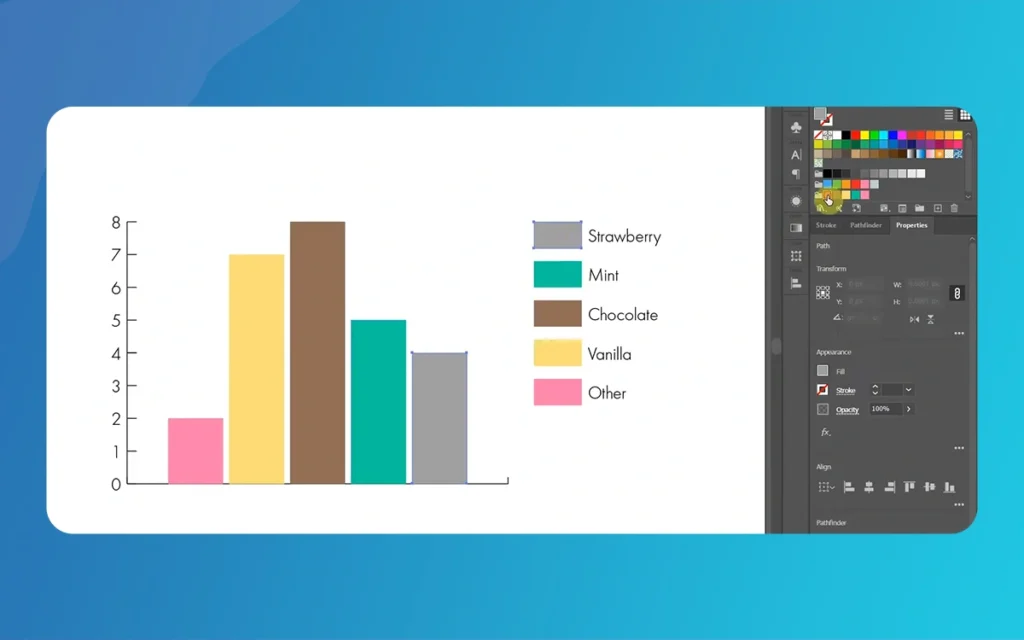
Graph axis customization remains essential exclusively for data visualization projects. When your Illustrator work involves presenting statistical information, survey results, or any numerical data requiring visual representation, these specialized controls provide the precision necessary for clear communication. The ability to override automatic calculations and add contextual labels transforms basic data sets into professional, publication-ready visualizations.
Ruler origin adjustment serves as your go-to solution for precise positioning tasks that don’t require global axis rotation. When you’re working on layouts with specific registration requirements, creating designs with measurements relative to particular reference points, or switching between different measurement contexts within the same document, this method offers the flexibility you need without the commitment of changing your entire coordinate system.
Performance and Reversibility
All three methods allow for easy reversal. The Constrain Angle can be reset to 0 degrees at any time, instantly restoring standard axis orientation. Graph modifications remain contained within graph objects, leaving the rest of your document unaffected. Ruler origin adjustments can be instantly reset with a double-click. This reversibility encourages experimentation, as you can freely test different approaches without fear of permanently disrupting your workspace configuration.
X and Y Axis in Illustrator
Common Use Cases and Real-World Examples
Architectural and Technical Drawing
Architects and technical illustrators frequently engage the Constrain Angle method when creating floor plans, elevations, and isometric projections. Setting the angle to 30 degrees for isometric work ensures that all drawing tools naturally range with the required perspective. This eliminates the tedious process of rotating each individual element after creation, significantly accelerating the drawing process while maintaining geometric accuracy.
Infographic and Report Design
Data journalists and information designers rely heavily on graph axis customization when building infographics for publications, presentations, and reports. The ability to standardize axis ranges across multiple related graphs ensures visual consistency, making it easier for audiences to compare different data sets. Adding currency symbols, percentage signs, or unit labels directly to axis values reduces the need for additional legends or explanatory text, creating cleaner, more intuitive visualizations.
Web and UI Design
Interface designers working on precise layouts often use ruler origin adjustment to establish measurement references rangeed with their grid systems. When designing responsive websites or mobile applications, setting the origin at specific breakpoints or grid intersections simplifies the process of make certain elements range correctly across different device sizes. This technique proves particularly valuable when translating design specifications into development code, as measurements can be taken directly from relevant reference points.
Pattern and Textile Design
Pattern designers creating repeating motifs for textiles, wallpapers, or decorative elements benefit from all three methods depending on their current task. The Constrain Angle helps create patterns based on non-orthogonal grids, such as hexagonal or diamond patterns. Ruler origin adjustment aids in precise tile range when establishing pattern repeats. Even graph tools find application in creating geometric patterns based on mathematical progressions or data-driven design concepts.
Troubleshooting Common Issues
Constrain Angle Disorientation
When you first apply a Constrain Angle, the rotated grid and tool behavior can feel counterintuitive. Your rectangle tool draws diamonds, your range options seem backwards, and familiar shortcuts produce unexpected results. This is normal. Give yourself time to adjust to the new orientation, and consider keeping a reference object at the original 0-degree angle visible in your workspace to maintain perspective.
If the rotated view becomes too disorienting, think of that you can temporarily reset the Constrain Angle to 0, complete specific tasks, then reapply your desired angle. Alternatively, work with Isolation Mode to edit individual objects in a standard orientation while maintaining the global axis rotation for the general document.
X and Y Axis in Illustrator
Graph Axis Scaling Problems
Occasionally, manually set axis values create scaling issues where data points appear compressed, stretched, or even fall outside the visible graph area. This typically occurs when the specified minimum and maximum values don’t appropriately encompass your data range. Always ensure your minimum value is less than your smallest data point and your maximum exceeds your largest data point.
If divisions create too many or too few tick marks, adjust the number of divisions rather than trying to compensate with different minimum and maximum values. Illustrator calculates division spacing by subtracting the minimum from the maximum and dividing by the number of divisions, so manipulating these values together achieves optimal results.
Ruler Origin Persistence
Sometimes the ruler origin appears to “snap” back to the default position unexpectedly. This often happens when switching between art boards in multi-art board documents, as each art board can maintain its own ruler origin. If you need consistent origins across multiple art boards, you’ll need to manually set the origin for each art board individually.
Another common issue occurs when users accidentally reset the ruler origin by double-clicking the ruler intersection while attempting other actions. If your origin suddenly returns to default unexpectedly, this is likely the cause. You can immediately undo the reset with Ctrl+Z (Windows) or Cmd+Z (Mac).
Quick Reference Table
Method
Best For
Scope
Reversibility
Basic Benefit
Constrain Angle
Isometric design, technical drawings, consistent angular work
Global (entire document)
Reset to 0° anytime
All tools and features range to rotated axes automatically
Graph Axis Customization
Data visualization, charts, infographics
Local (specific graph object)
Modify graph settings anytime
Precise control over data presentation and numerical scales
Flexible measurement reference without affecting object geometry
Default Setting
Standard orthogonal design, general illustration
Standard workspace
N/A – default state
Familiar orientation, ranges with artboard edges
Combined Methods
Complex projects requiring multiple approaches
Mixed as needed
Each method independently reversible
Maximum flexibility for various project requirements
Finally
Mastering X and Y axis manipulation in Illustrator is a key step toward advanced proficiency. This guide covers three methods: rotating axes with Constrain Angle, customizing graph axes for data, and adjusting ruler origins for precise layout—all tailored to specific design needs.
Constrain Angle reorients your workspace, ideal for uniform angular projects. Graph axis customization upgrades basic charts to professional graphics, while ruler origin adjustment enables precise layouts without global changes.
Knowing when to apply each technique comes with experience and experimentation. A complex project might require all three methods at different stages, or you might find that your work consistently benefits from one main approach. The key is recognizing that these tools exist to serve your creative vision, not to constrain. Using these axis methods in your workflow increases efficiency, precision, and creativity. Working in non-standard orientations, presenting polished data, and measuring accurately sets advanced users apart from beginners.ngs.
Commit to practicing each method in your design context. Proactively create test documents and challenge yourself to experiment freely, embrace mistakes, and seek solutions without fear of deadlines. Turn hands-on experience into expertise by intentionally applying these skills when you work on actual client projects or personal creative work.
X and Y Axis in Illustrator
Illustrator’s axis manipulation options reflect its philosophy: giving designers precise control over their work. By mastering these coordinate system controls, you gain a deeper understanding of vector graphics that will inform all your future projects.
Best Way To Create Cinematic lighting in Unreal Engine 5 by Morphic Studio [Tutorial]
The Magic of Cinematic lighting in Unreal Engine 5 Have you ever looked at a beautifully rendered game or a virtual film set and wondered how they make it look so incredibly real? Well, the answer almost always comes down to the lighting. Today, we are going to take a look at the magic of […]
July 20, 2026
How To Add Lighting Realistic Rainy Weather in Unreal Engine 5 [Tutorial]
Lighting a stormy environment in Unreal Engine 5 is one of the most rewarding challenges for any 3D environment or lighting artist. Many beginners think that adding rain is as simple as spawning a splash particle system and turning down the sun, but the real secret lies in how light interacts with moisture, clouds, and […]
July 18, 2026
How To Add Lighting Rainy Atmospheric in Unreal Engine 5 [Tutorial]
Hello everyone, and welcome to this new guide. If you are a game developer or a 3D artist, you probably know how important weather is. Creating a moody scene can completely change how a player feels. Today, we are going to look at something very specific. We are going to learn how to add Lighting […]