Creating visually appealing and customized graphs is essential for effective data visualization. Adobe Illustrator offers powerful tools to transform standard graphs into unique, editable designs. The Morphic Studio shares the process of converting complex Illustrator Graph to Editable Shapes, enabling unlimited creative possibilities.
Follow the Importance of Editable Shapes
When working with graphs in Illustrator, the ability to convert Illustrator Graph to Editable Shapes opens up a world of creative possibilities. Standard graphs can be limiting in terms of design flexibility, but once converted to shapes, every element becomes customizable. This transformation allows designers to maintain data accuracy while creating visually stunning presentations.
Essential Tools and Prerequisites
Before diving into the conversion process, familiarize yourself with these fundamental Illustrator tools:
Tool Name
Primary Function
When to Use
Graph Tool
Creates basic graphs from data
Initial graph creation
Direct Selection Tool (A)
Selects individual elements
Fine-tuning specific parts
Pathfinder Tool
Combines or subtracts shapes
Complex shape manipulation
Shape Builder Tool
Merges shapes intuitively
Custom shape creation
Shaper Tool
Creates new shapes from existing ones
Advanced shape manipulation
Step-by-Step Conversion Process
1. Initial Graph Creation
The foundation of a successful conversion begins with properly created graphs. Start by selecting the Graph Tool from the Tools panel. Illustrator offers various graph types, including bar, pie, and line graphs. When entering your data, ensure accuracy as this will be your last chance to work with the numerical values directly.
After inputting your data, take a moment to review the basic graph structure. This initial layout will serve as your blueprint for the creative transformation ahead.
2. Ungrouping the Graph Elements
The critical step in making your graph editable involves ungrouping its components. This process requires careful attention:
Select the entire graph structure
Negotiate to Object > Ungroup (this may need to be done multiple times)
Verify that all elements are independently selectable
Think of that once ungrouped, the graph cannot be regenerated with the original data. This step marks the point of no return in terms of maintaining energetic data connections.
3. Element Manipulation and Customization
With your graph now ungrouped, each element becomes an independent shape ready for customization. This phase offers the most creative freedom:
Use the Direct Selection Tool to modify individual anchor points
Apply custom colors and gradients to specific elements
Adjust stroke mass and styles
Implement effects like shadows or glows
Modify text elements for enhanced readability
4. Advanced Shape Editing
The Pathfinder Tool becomes irreplaceable for creating complex shapes from your graph elements. Consider these advanced editing techniques:
Combine multiple shapes to create unique visual elements
Use the Shape Builder Tool for intuitive merging and division of shapes
Experiment with clipping masks for creative effects
Apply patterns or textures to individual elements
5. Organization and Layer Management
Proper organization becomes crucial as your design grows more complex:
Create logical layer groups for different graph elements
Label layers clearly for easy navigation
Use sublayers to manage related components
Lock completed elements to prevent accidental modifications
Best Practices for Professional Results
Maintaining Visual Hierarchy
When customizing your graph elements, always consider the visual hierarchy:
Keep important data points prominent
Use consistent styling for related elements
Ensure text remains legible after modifications
Balance decorative elements with data clarity
Illustrator Graph to Editable Shapes By The Morphic Studio
Color and Style Considerations
Thoughtful color selection enhances both attractive and readability:
Choose a cohesive color palette
Consider color psychology for data representation
Maintain adequate contrast for clarity
Use gradients and effects judiciously
Quality Assurance
Before finalizing your design:
Verify all data points are accurately represented
Check range and spacing
Test print at various sizes
Review text legibility
Ensure consistent styling across similar elements
Troubleshooting Common Issues
Follow common challenges can help avoid potential pitfalls:
Lost elements after ungrouping: Use the Layers panel to locate hidden objects
Inconsistent scaling: Group related elements before resizing
Text formatting issues: Convert text to outlines when necessary
Shape distortion: Use the Scale tool instead of free transform
Advanced Techniques for Complex Designs
For those seeking to push creative boundaries:
Implement 3D effects for depth and dimension
Create custom patterns from graph elements
Use blend modes for unique visual effects
Incorporate custom illustrations within graph elements
Saving and Exporting
Proper file management ensures your work remains accessible and editable:
Save in native AI format for maximum editability
Create backup copies at basic stages
Export in appropriate formats for different use cases
Document any custom effects or modifications
Finally
Converting complex Illustrator Graph to Editable Shapes unpick unlimited creative potential while maintaining data integrity. This process requires careful attention to detail and a strategic approach to organization, but the resulting flexibility in design makes it well worth the effort. By following these guidelines and best practices, you can transform standard graphs into unique, professional visualizations that effectively communicate your data while maintaining visual appeal.
Think of that practice and experimentation are basic to mastering these techniques. Start with simple conversions and gradually work your way up to more complex transformations as your confidence and skill magnitude increase.
Animation company in Ahmedabad: 10 Astonishing Visual Trends to Skyrocket Conversions – The Morphic Studio
Hello there! If you are reading this, you are probably trying to figure out how to make your brand stand out. Let us be honest, the statistical world is very crowded right now. People are scrolling past boring content faster than you can blink. That is exactly why working with an Animation company in Ahmedabad […]
June 27, 2026
Animation studio in Ahmedabad: 10 Jaw-Dropping Styles to Massively Boost Sales , The Morphic Studio
Why Choosing an Animation studio in Ahmedabad Changes the Game Finding the right creative partner is the secret to making this work. When you partner with a specialized Animation studio in Ahmedabad, you get access to world class talent without the bloated costs of overseas agencies. At The Morphic Studio, we understand that pretty pictures […]
June 26, 2026
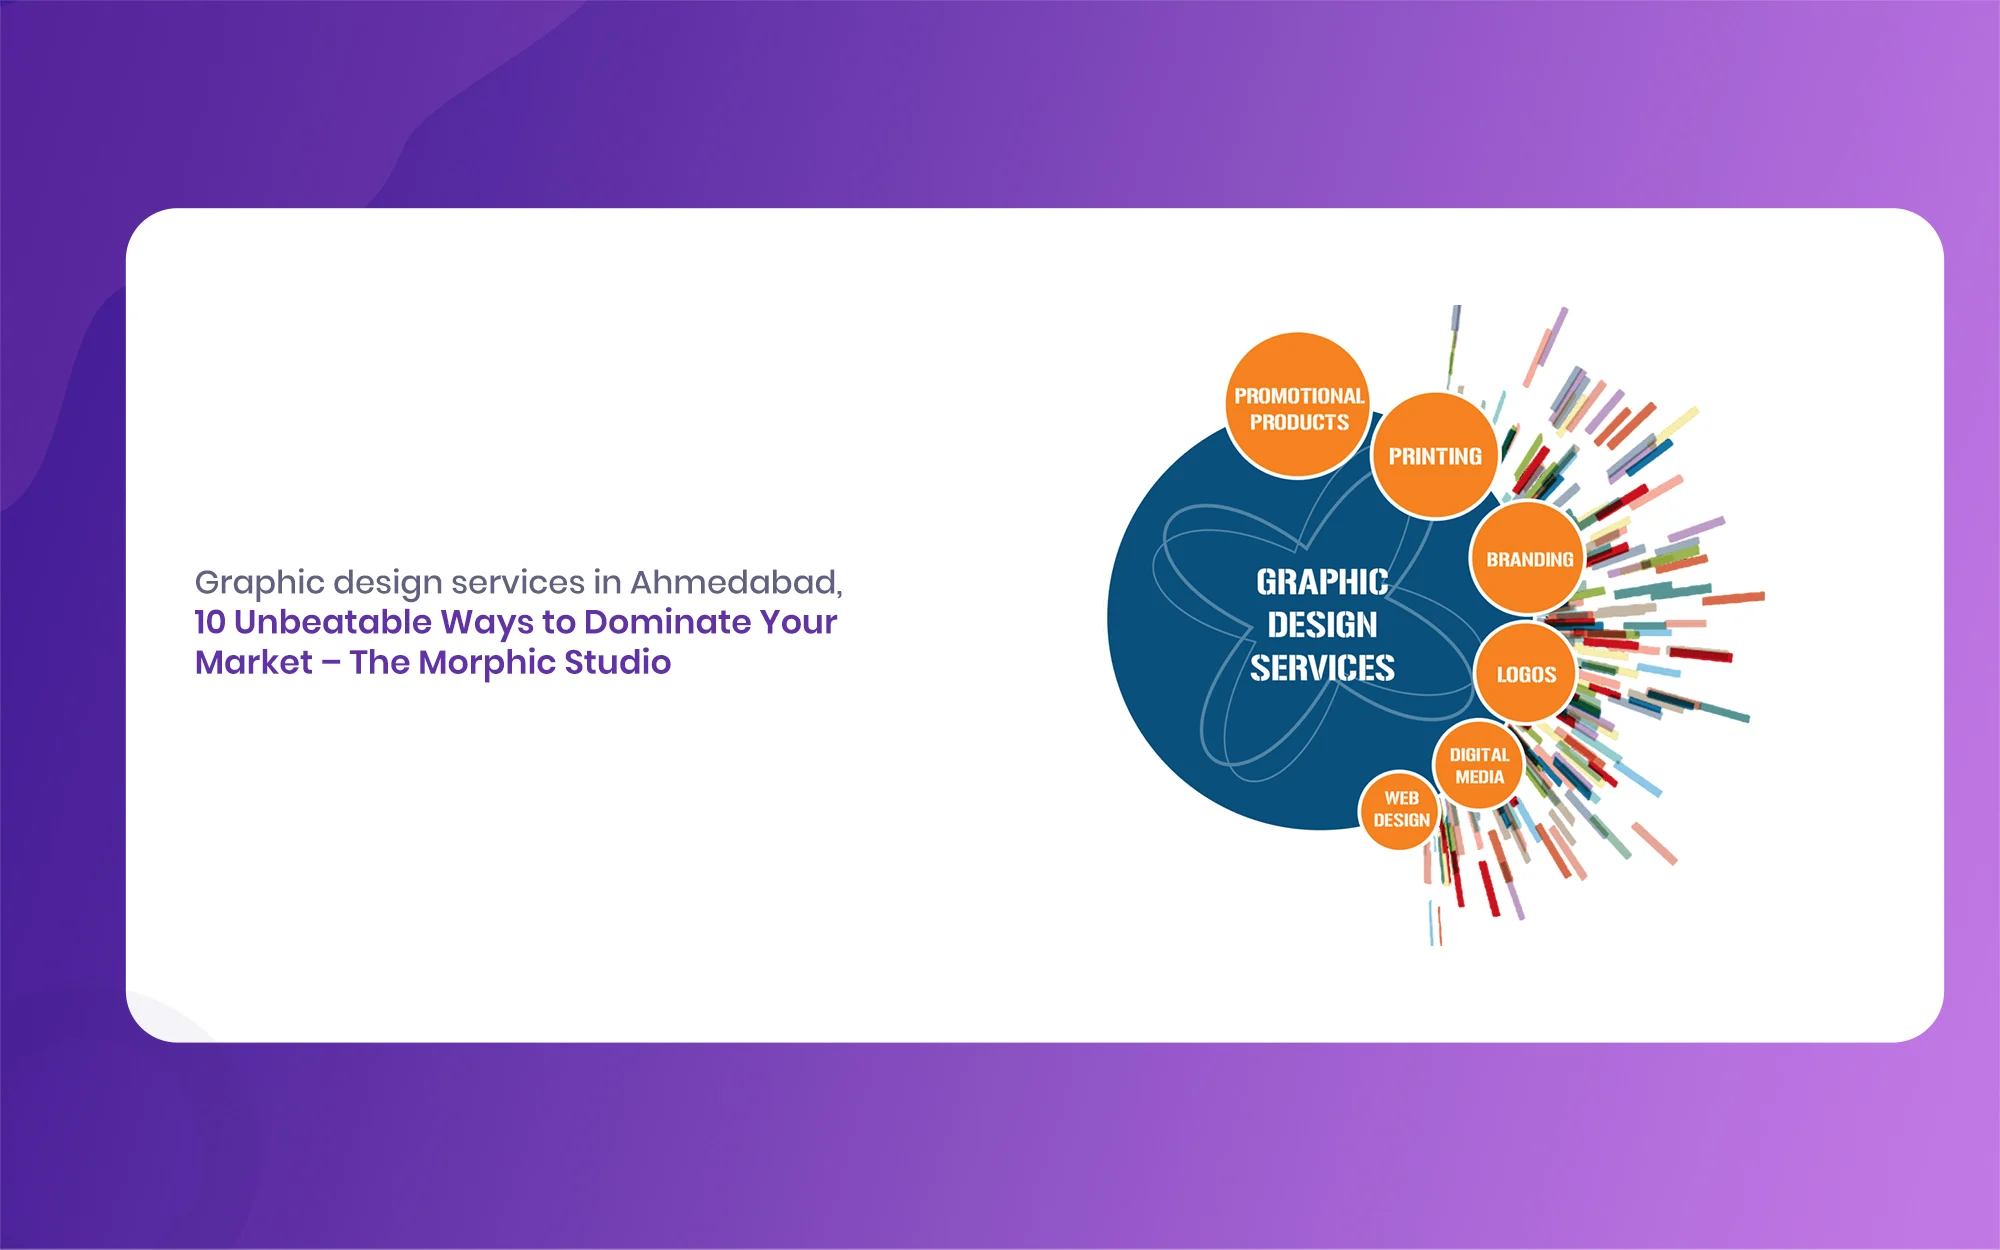
Graphic design services in Ahmedabad: 10 Unbeatable Ways to Dominate Your Market, The Morphic Studio
At The Morphic Studio, we deeply understand that Graphic design services in Ahmedabad is not just about making things look pretty on a screen. It is about solving real business problems, telling a great story, and turning casual viewers into highly loyal customers. Today we are going to talk about the latest 2026 internet trends […]